Wind And Solar Are Cheap - Until You Check The Numbers
Beware of claims that wind and solar are a cheap route to cleaning up our energy supply, some of the published studies don't stand up to close scrutiny.
A number of studies have been published claiming to show that a mix of 100% renewables can provide all the energy needed to replace oil and gas and reach the elusive Net Zero targets by 2050.
One such study, from Stanford University claims to have modeled the energy use in 145 countries and come up with a plan for decarbonization in all those countries using only wind, water, and solar, often abbreviated to WWS, although the plan also includes some geothermal energy.
Professor Mark Z Jacobson is an anti-nuclear zealot who actively promotes this study on social media, claiming at every opportunity that any country can decarbonize its energy supply using only wind, water, and solar.
However, the study of 145 countries is superficial, it presents the results from a computer model that suffers from inaccurate inputs. It’s an academic exercise that takes no account of the practical aspects of locating and constructing thousands of solar panels, wind turbines and thermal storage systems, and the minerals and metals needed to build those facilities.
I looked at their proposal for the UK, and I found it seriously deficient.
The starting point for the study is a base year of 2016, and a claimed total “business as usual” energy use of 193.9 Gigawatts. (I have no idea why they choose to express energy use in terms of average hourly use (GW) rather than total use (TWh)).
That figure is then inflated to 233 GW for the BAU case in 2050. For the WWS case, the number reduces to 88.8 GW, a 62% reduction that comes from three adjustments:
1. A 44% reduction comes from the higher energy efficiency of electric use compared to the combustion of gas and motor fuels.
2. A 9% saving from the elimination of the energy used to extract oil and gas and mine coal.
3. A 9% saving comes from efficiency improvements.
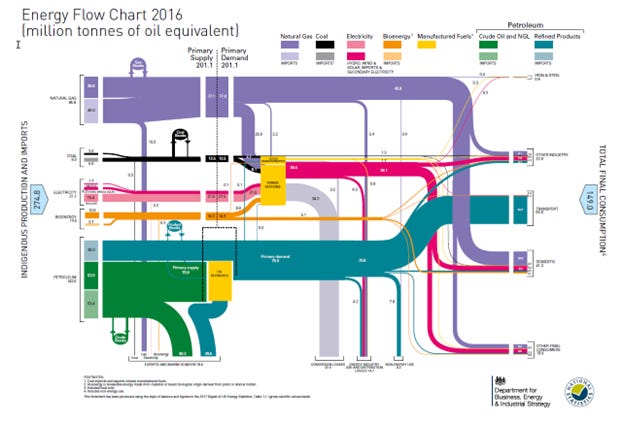
Here’s an energy flow chart from the UK for 2016:
Total UK final energy consumption was 140.7 million tonnes of oil equivalent per year (excluding petroleum for non-energy use). That converts to an average power use of 186.7 GW, close enough to the Stanford figure of 193.9.
However, in the chart, energy industry use and distribution losses are excluded from the final total, so the 9% saving from the elimination of oil, gas, and coal industry use does not apply. In fact, energy losses in electricity distribution must be added to estimate the energy that has to be generated.
Another discrepancy arises from natural gas use (domestic and other), most of which is building heat and hot water. Stanford is proposing to replace this with an underground thermal storage system (UTES) with 56% efficiency compared to 80% efficiency for gas boilers, so the energy use for that component increases by 43%.
After making those adjustments, I have calculated an energy requirement of 172.8 GW, almost twice the figure assumed in the Stanford study (Calculations in the table below).
The energy demand assumed by the study is off by a factor of almost 2.
Let’s move on to the components of the Stanford study:
Energy generation is provided mostly by wind, solar, and some tidal and wave power.
There is a combined 156.5 GW of wind power and a whopping 346.5 GW of solar power plus 14.4 GW of new wave and tidal power. Hydroelectric power already exists, and the UK has very little potential to increase hydroelectric power.
Below is a list of the proposed storage facilities:
There is a total of 8.6 TWh of storage that can be used to generate electricity. However, 7.27 TWh of that is restricted in that it can only generate 1.9 GW of power, the limit of existing hydroelectric generators. The proposed batteries have more than enough input and output capacity, but only two hours of storage at full capacity (100 GW of 10-hour battery would be a better choice).
The study divides the energy load into flexible and inflexible loads. The flexible load is the UTES, a small amount of cold storage for summer air conditioning, 7.73 GW of demand response load, and 27 GW of hydrolyzers for hydrogen production. The inflexible load amounts to 40.5 GW.
Basically, the study is proposing a massive overbuild of renewables, especially wind and solar. The total installed nominal generating capacity is 520 GW to service an average load of 48.03 GW (of which 7.73 GW can be adjusted by demand response). During periods when the wind is blowing and the sun is shining, the oversupply goes to heating water and storing it underground for use as building heat and hot water, and anything left over is used to make hydrogen. The massive overbuild reduces the need for storage that can be converted to electricity, and the major storage component is heat in the form of hot water stored underground.
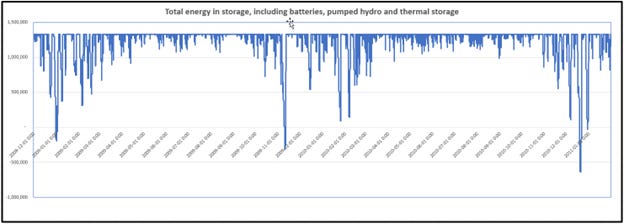
Stanford used a climate prediction model to simulate the wind and solar generation for 2050. I think a better approach would be to use historical data, I have chosen the period between December 2008 and February 2011, because that was a period when winds were light, and temperatures were below average. (These systems must be designed for worst-case conditions, using averages will not give you a reliable, robust system). Inputting the proposed WWS generators into a simulation, using Stanford’s estimates of demand, I found that there are four periods when the storage runs out, and there is not enough generating capacity to meet demand:
The chart above shows the amount of energy in storage at any time, excluding the hydro reservoirs (assuming a starting point of full storage). In my analysis I used the hydro storage whenever the batteries and other storage fell below the maximum. Most of the time, the storage is full, and the batteries are fully charged and on standby for periods when the renewables fail to deliver. Those periods of inadequate power occur in winter when solar energy is at its weakest, and during a period of low wind. The batteries drain very quickly and there is not enough reliable power to meet demand. That happened four times during the two-year period analyzed.
Demand response does not help very much, the problem cannot be solved by a temporary dip in demand during peak hours. The problem is a severe shortage of flexible generating capacity. What the system needs is a baseload of reliable power generation that can produce power when there is no wind or solar.
The chart illustrates the stupidity of using batteries as storage for a grid that relies on wind power. The very expensive batteries must sit fully charged for long periods, waiting for a wind drought, they only discharge fully one or two times a year and rarely use more than a fraction of their capacity.
It also illustrates the stupidity of aiming for zero emissions with a wind and solar-dominated grid. A backup power supply using diesel generators could eliminate the need for most of those massive batteries and still achieve emission reductions well above ninety percent.
Minor changes in assumptions and the fact that I used a worst-case year for wind loads probably explain the difference between my analysis and Stanford’s with respect to electrical storage needs, but what is being proposed is a long way from being a reliable grid.
Let’s move on to look at the proposed system of domestic hot water and building heat, the underground thermal storage system or UTES. Similar systems do exist, but nothing on the scale of what is being proposed. The systems can be expensive, they are inefficient and many of the existing systems make use of backup supplementary heat.
Underground storage can be in large tanks, aquifers, or boreholes that warm the surrounding soil. The Stanford study provides no details and it is unlikely that they have developed any real details for such a system.
Stanford’s parameters for the UTES system are:
Maximum input 49.46 GW (49 GW from oversupply of wind and solar)
Maximum output 32.66 GW
Storage 11.76 TWh
A number of studies have attempted to predict peak UK domestic gas demand, including this paper by S.D.Watson at Loughborough University. He comes up with a figure of 170 GW including heating and domestic hot water. The 170 GW is gas consumption, which translates to 136 GW of heat required to cover peak demand at 80% boiler efficiency. It is the lowest estimate among a number of studies that I read, and it includes only domestic consumption; heating for commercial buildings is not included. It is more likely that I have underestimated rather than overestimated demand.
However, at 32.66 GW, Stanford’s estimate of the maximum required UTES heat output is off by a factor of more than 4.
But the shortfall in peak output is not the biggest discrepancy, that honor belongs to the lack of adequate storage. The chart below (taken from the S.D.Watson paper) shows the domestic heat load over the course of the year. As expected, the bulk of the heat load is in the colder months from November to May
Here’s a chart showing the surplus electricity that would be available from the proposed WWS generators:
As you can see, the supply is totally out of sync with the demand. Massive storage is needed to capture the surplus energy from the summer months to provide heat for the winter. An analysis of wind and solar capacity factors for the 2009/2010 period shows a requirement to store about 250 TWh of input energy, enough for 140 TWh of output heat.
Stanford’s estimate for heat storage (11.74 GWh) is off by a factor of more than 12.
Now, let’s take a look at the cost.
The Stanford study tells us that the plan will have an upfront cost of $880 billion, I quote from their report:
“Has an upfront cost of $880 billion (for WWS electricity, heat, H2 generation; electricity, heat, cold, H2 storage; short- and long-distance transmission; distribution)”
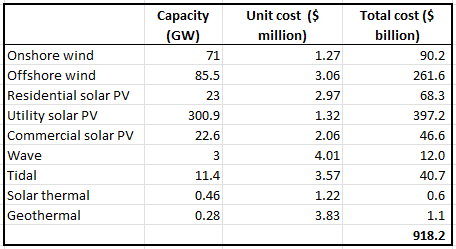
Let’s take a closer look at that cost estimate (using Stanford’s unit costs for the generating facilities).
Although the study claims to have included storage, hydrogen, transmission, and distribution, the figure for generation alone exceeds the claimed $880 billion. (I omitted the existing hydro facilities from the costs, but I included all existing wind and solar since all will reach their end of life by 2050).
To that figure, we need to add the cost of 970 GWh of batteries, which I estimate to be $300 billion for a total of $1.218 trillion.
However, as I pointed out earlier, that only provides about half of the required energy, we need to double everything to get the real costs. So, now we are at $2.4 trillion plus transmission and distribution costs which will likely add another $100 billion or more.
Finally, we need to add the UTES system, which the Stanford team seems to have omitted from their cost estimates.
The cost is difficult to estimate. A report from the International Renewable Energy Agency (IRENA) gives a range of 0.1 to 35 $/kWh. The fact that the upper end of the range is 350 times the lower end indicates the level of uncertainty and lack of real background data on such systems.
If we take the middle of that range ($17.50/kWh) and 140 TWh per year of output heat, we arrive at a figure of $2.45 trillion. That seems like a high number but considering that it involves drilling millions of deep boreholes, and building a pumping and distribution system to route hot water to every building in the country, I question whether it is even practical at any cost.
So, the real cost of the complete energy transition using Stanford’s proposed methods will be around $5 trillion. That’s for an energy supply that might fail during a wind drought and leave the country without power, or any means of heating during an exceptionally cold winter.
I think I’d rather take my chances with heat pumps and nuclear power, thankyou.


Thanks for this article. Interesting.
There are many things to say about such study. Just to name a few:
- Target of 100% is extremely difficult. It might be much cheaper/easier to target 80/90%. Perfect is the enemy of good.
- I struggle to see how the economics of a system composed of 156.5 GW of wind power and a whopping 346.5 GW of solar power would work. Basically, you need some sort of centralized planning as investing in an additional GW of solar would bring you very low economical benefit (because of the existing solar surplus, check my substack for such considerations).
- Thermal storage is a great system. But let's be practical, there is no way that you can have such a huge system storage within 2050 (it would take decades to build and retrofit buildings).
-
Great analysis, I’m always taking projections with a grain of salt so its good to see some realistic numbers put to them.